Accountant Salary in Gresham, OR: $85,663 (2026)
Quick Answer:A full-time accountant in Gresham, OR earns a median $85,663/year (≈ $41.19/hour) in nominal terms for 2026 — projected from BLS OEWS 2025 (SOC 13-2011). Once you factor in Gresham's price level (3% above national, BEA RPP 102.6), that paycheck buys what $83,492 would nationally. Nominal pay sits 2.3% above the Oregon state average.
Based on BLS state-level estimates · View source
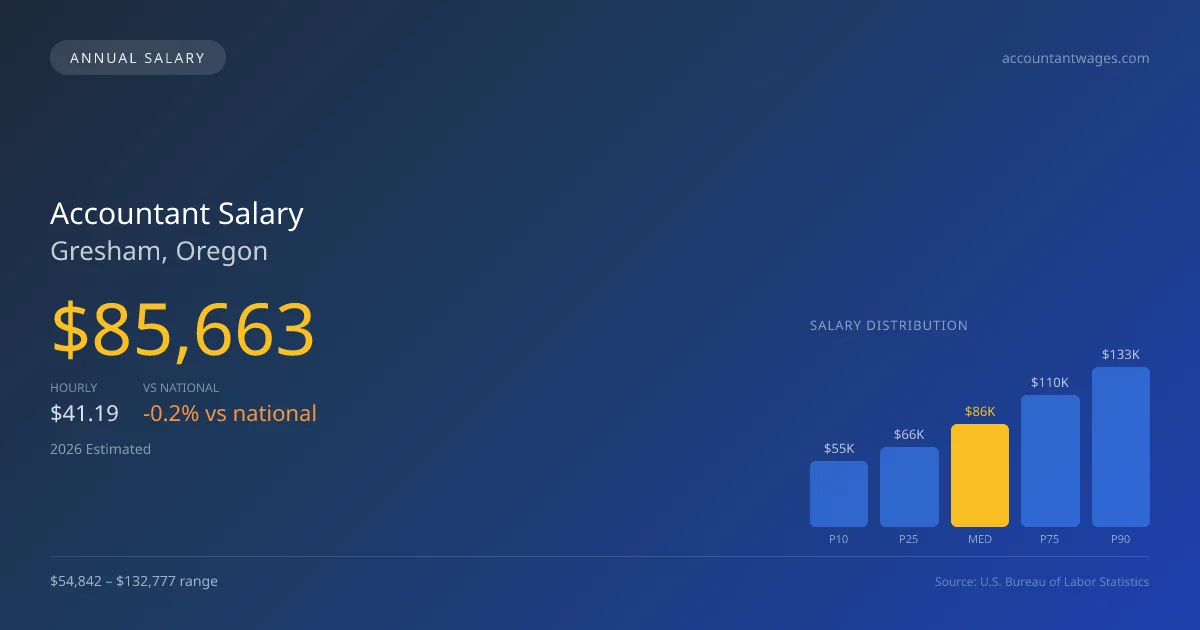
In Gresham, Oregon, the average accountant salary reaches $85,663 in 2026, highlighting a strong compensation potential in the local market. Salaries for accountants here vary significantly, stretching from $54,842 at the low end to as much as $132,777 for top earners, driven in part by the value of a CPA license. With licensure, professionals can expect a substantial pay increase as they progress from staff positions to more senior roles. These figures, based on 2025 BLS data projected to 2026, reflect the unique dynamics of the Gresham job market, which offers promising opportunities for both licensed and aspiring accounting professionals.
About the Gresham Market
Salary estimated from Oregon average ($82,000) adjusted for local cost of living.
Salary Breakdown
| Percentile | Annual | Hourly |
|---|---|---|
| Entry Level (P10) | $54,842 | $26.37 |
| Lower Range (P25) | $66,316 | $31.88 |
| Median (P50)(typical) | $85,663 | $41.19 |
| Upper Range (P75) | $109,649 | $52.72 |
| Top Earners (P90) | $132,777 | $63.83 |
Median Salary Position
0.23% below the national average
2026 Salary Percentile Distribution in Gresham
In Gresham, OR, the accountant salary spread from the 10th to 90th percentile is $77,935 (2026 est.). At $85,663, the local median is 0.23% below the national median of $85,864.
Salary Calculator
At 40 hours/week in Gresham: You'd be in the lower-middle range
How Gresham Accountant Pay Compares
Gresham median: $85,663/year (2026)
| Compared To | Median Salary | Gresham Pays |
|---|---|---|
| Oregon Average | $83,737 | +2.30% more |
| National Average | $85,864 | -0.23% less |
Accountants in Gresham, OR earn a median of $85,663 per year (2026 est.), which is 0.23% lower than the national median of $85,864 and 2.30% above the Oregon state average of $83,737.
Cost-of-Living Adjusted Salary
Gresham has a cost of living 2.60% above the national average.
Adjusted salary = nominal × (100 / CoL index). CoL index: 100 = national average.
Gresham, OR has a cost-of-living index of 102.6 (above the national average of 100). While the nominal salary of $85,663 is competitive, the higher cost of living reduces purchasing power to an effective $83,492 — a 2.53% reduction.
Compare Purchasing Power
Select a city to see how your salary compares after cost of living
Select a city above to compare purchasing power
2019 BLS Actual
$71,382
2025 BLS Actual
$83,484
2026 Current Est.
$85,663
2019–2027 Growth
+23.1%
Salary Trajectory for Accountants in Gresham (2019–2027)
2019–2025: actual BLS OEWS data for this metro area. 2026+: CAGR 2.61% projection.
| Year | Annual Salary | Status |
|---|---|---|
| 2019 | $71,382 | Actual |
| 2020 | $73,388 | Actual |
| 2021 | $77,069 | Actual |
| 2022 | $77,817 | Actual |
| 2023 | $79,693 | Actual |
| 2024 | $86,085 | Actual |
| 2025 | $83,484 | Actual |
| 2026(current) | $85,663 | Estimated |
| 2027 | $87,899 | Projected |
Based on 7 years of BLS OEWS data for the Gresham metropolitan area, the median accountant salary grew 17.0% from $71,382 (2019) to $83,484 (2025). At a 2.61% compound annual growth rate, salaries are projected to reach $87,899 by 2027 — a total increase of $16,517 (23.14%) from 2019.
Note: Historical values (2019–2025) are actual BLS OEWS figures for the Gresham metropolitan area, sourced from annual Occupational Employment and Wage Statistics surveys. 2026–2026 figures are current estimates, and 2027 values are projections, calculated using a 2.61% CAGR derived from 7-year BLS historical data. Actual salaries may vary based on employer, experience, certifications, and local market conditions.
Salary by Experience Level
| Experience | Estimated Salary Range |
|---|---|
| 0-2 years (New Graduate) | $54,842 – $66,316 |
| 3-5 years (Mid Career) | $66,316 – $85,663 |
| 5+ years (Experienced) | $85,663 – $109,649 |
| 10+ years (Top Earner) | $109,649 – $132,777 |
CPA salary ranges estimated from BLS percentile data. Individual accountant compensation varies by employer, certifications, and specialization.
Accountant Job Market in Gresham
The accountant workforce in Gresham comprises about 21 employed accountants, who face a cost of living index of 102.6, indicating that living expenses are slightly above the national average. This financial landscape translates to a nuanced understanding of take-home pay and how far it stretches in the local economy. Among the highest paying employers in the area are regional CPA firms and corporate accounting departments, which offer competitive salaries to attract talented accountants. Variability arises from factors such as the firm tier, the presence of the CPA license, and the specialty of work, such as federal or state government roles that typically provide more stable compensation. For those aiming to maximize earnings, specializing in tax, forensic accounting, or pursuing a partner track in a public firm could yield significant advantages within the Gresham market—since these roles often come with pay incentives, bonuses, and overtime opportunities during busy seasons. Understanding these nuances will better equip accountants to navigate their career trajectories in Gresham, OR.
More salary data for Gresham, OR:
Frequently Asked Questions
How much do accountants make in Gresham, OR in 2026?
Is Gresham, OR a good place to work as a accountant?
Can accountants make $100K in Gresham?
What is the cost-of-living adjusted accountant salary in Gresham?
How much does a accountant make per hour in Gresham?
Related Pages
Compare Salaries
Career Resources
Nearby Cities in Oregon
Written by Sofia Patel, CPA
Career Analyst
Sofia Patel has over 10 years of experience in financial analysis. She specializes in tax preparation for small businesses. She has worked in both corporate and public accounting environments.
Methodology & Data Source
Salary figures on this page are 2026 projections based on the Bureau of Labor Statistics Occupational Employment and Wage Statistics (OEWS) survey, May 2026 release. The BLS reported a median annual salary of $83,484 for accountantsin the Gresham metropolitan area. A 2.61% compound annual growth rate (CAGR), calculated from 6-year national BLS wage trends, was applied to project current 2026 compensation. Percentile ranges (P10–P90) represent the full salary distribution across experience levels and practice settings in this market.
Data Sources & Methodology
Salary data for Gresham is estimated from official BLS state-level occupational wage data (2025), adjusted for regional cost-of-living differences using BEA RPP (Regional Price Parities).
2026 figures are projected from 2025 BLS data using a compound annual growth rate (CAGR) of 2.61%, derived from historical BLS wage trends for accountants (SOC 13-2011).
Compiled and verified by Sofia Patel, CPA, a licensed accountant with 10+ years of clinical experience. · View source data at BLS.gov