Accountant Salary in Northampton, MA: $85,446 (2026)
Quick Answer:A full-time accountant in Northampton, MA earns a median $85,446/year (≈ $41.09/hour) in nominal terms for 2026 — projected from BLS OEWS 2025 (SOC 13-2011). Once you factor in Northampton's price level (9% above national, BEA RPP 108.5), that paycheck buys what $78,752 would nationally. Nominal pay sits 10.5% below the Massachusetts state average.
Based on BLS state-level estimates · View source
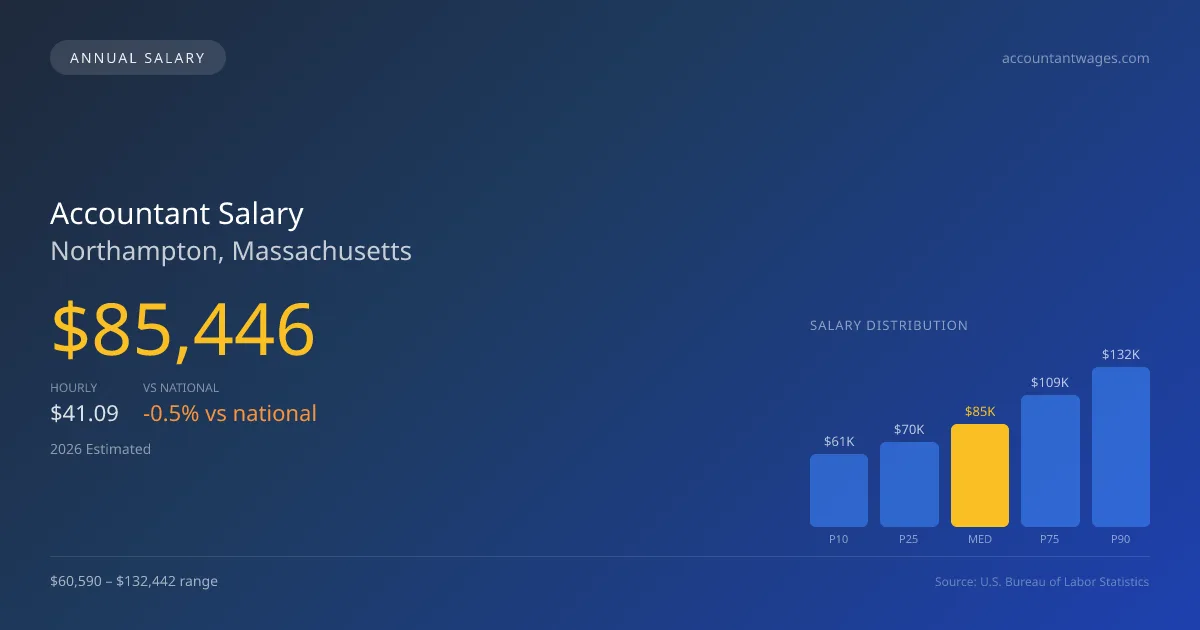
Accountants in Northampton, Massachusetts, can expect a median annual salary of $85,446 in 2026, which positions them slightly below the national median of $85,864. The salary range for this profession in the area extends from $60,590 at the 10th percentile to $132,442 at the 90th percentile, highlighting the significant variation in pay based on experience and specialization. These figures reflect local estimates drawn from 2025 BLS state-level data and adjusted for regional cost considerations. The disparity between salaries at leading firms, like the Big 4 accounting firms, and other regional or corporate roles influences the earning potential for accountants, creating a dynamic job market in Northampton.
About the Northampton Market
Salary estimated from Massachusetts average ($98,000) adjusted for local cost of living.
Salary Breakdown
| Percentile | Annual | Hourly |
|---|---|---|
| Entry Level (P10) | $60,590 | $29.13 |
| Lower Range (P25) | $70,297 | $33.80 |
| Median (P50)(typical) | $85,446 | $41.09 |
| Upper Range (P75) | $109,371 | $52.58 |
| Top Earners (P90) | $132,442 | $63.67 |
Median Salary Position
0.49% below the national average
2026 Salary Percentile Distribution in Northampton
In Northampton, MA, the accountant salary spread from the 10th to 90th percentile is $71,852 (2026 est.). At $85,446, the local median is 0.49% below the national median of $85,864.
Salary Calculator
At 40 hours/week in Northampton: You'd be in the lower-middle range
How Northampton Accountant Pay Compares
Northampton median: $85,446/year (2026)
| Compared To | Median Salary | Northampton Pays |
|---|---|---|
| Massachusetts Average | $95,471 | -10.50% less |
| National Average | $85,864 | -0.49% less |
Accountants in Northampton, MA earn a median of $85,446 per year (2026 est.), which is 0.49% lower than the national median of $85,864 and 10.50% below the Massachusetts state average of $95,471.
Cost-of-Living Adjusted Salary
Northampton has a cost of living 8.50% above the national average.
Adjusted salary = nominal × (100 / CoL index). CoL index: 100 = national average.
Northampton, MA has a cost-of-living index of 108.5 (above the national average of 100). While the nominal salary of $85,446 is competitive, the higher cost of living reduces purchasing power to an effective $78,752 — a 7.83% reduction.
Compare Purchasing Power
Select a city to see how your salary compares after cost of living
Select a city above to compare purchasing power
2019 BLS Actual
$71,202
2025 BLS Actual
$83,273
2026 Current Est.
$85,446
2019–2027 Growth
+23.1%
Salary Trajectory for Accountants in Northampton (2019–2027)
2019–2025: actual BLS OEWS data for this metro area. 2026+: CAGR 2.61% projection.
| Year | Annual Salary | Status |
|---|---|---|
| 2019 | $71,202 | Actual |
| 2020 | $73,202 | Actual |
| 2021 | $76,874 | Actual |
| 2022 | $77,621 | Actual |
| 2023 | $79,491 | Actual |
| 2024 | $101,775 | Actual |
| 2025 | $83,273 | Actual |
| 2026(current) | $85,446 | Estimated |
| 2027 | $87,677 | Projected |
Based on 7 years of BLS OEWS data for the Northampton metropolitan area, the median accountant salary grew 17.0% from $71,202 (2019) to $83,273 (2025). At a 2.61% compound annual growth rate, salaries are projected to reach $87,677 by 2027 — a total increase of $16,475 (23.14%) from 2019.
Note: Historical values (2019–2025) are actual BLS OEWS figures for the Northampton metropolitan area, sourced from annual Occupational Employment and Wage Statistics surveys. 2026–2026 figures are current estimates, and 2027 values are projections, calculated using a 2.61% CAGR derived from 7-year BLS historical data. Actual salaries may vary based on employer, experience, certifications, and local market conditions.
Salary by Experience Level
| Experience | Estimated Salary Range |
|---|---|
| 0-2 years (New Graduate) | $60,590 – $70,297 |
| 3-5 years (Mid Career) | $70,297 – $85,446 |
| 5+ years (Experienced) | $85,446 – $109,371 |
| 10+ years (Top Earner) | $109,371 – $132,442 |
CPA salary ranges estimated from BLS percentile data. Individual accountant compensation varies by employer, certifications, and specialization.
Accountant Job Market in Northampton
In terms of local employment dynamics, there are currently six accountants serving the community, which signifies a competitive, albeit more limited, labor market. With a cost of living index of 108.5, employees might find their take-home pay’s purchasing power slightly diminished compared to the national average. Among the key employers in Northampton, Big 4 firms often provide the highest salaries, but they also maintain high expectations regarding work hours during peak periods, like tax season. The pay difference stems from CPA licensing requirements, the tier of public firm, and the demand for specialized skills in areas like tax and forensic accounting. Professionals aiming to maximize their earnings should consider developing expertise in these high-demand specialties while pursuing opportunities in public firms that tend to have the highest compensation structures. Additionally, transitioning from public to industry roles can lead to increased financial rewards, as corporate accounting departments offer competitive salaries for experienced accountants in Northampton.
More salary data for Northampton, MA:
Frequently Asked Questions
How much do accountants make in Northampton, MA in 2026?
Is Northampton, MA a good place to work as a accountant?
Can accountants make $100K in Northampton?
What is the cost-of-living adjusted accountant salary in Northampton?
How much does a accountant make per hour in Northampton?
Related Pages
Compare Salaries
Career Resources
Nearby Cities in Massachusetts
Written by Sofia Patel, CPA
Career Analyst
Sofia Patel has over 10 years of experience in financial analysis. She specializes in tax preparation for small businesses. She has worked in both corporate and public accounting environments.
Methodology & Data Source
Salary figures on this page are 2026 projections based on the Bureau of Labor Statistics Occupational Employment and Wage Statistics (OEWS) survey, May 2026 release. The BLS reported a median annual salary of $83,273 for accountantsin the Northampton metropolitan area. A 2.61% compound annual growth rate (CAGR), calculated from 6-year national BLS wage trends, was applied to project current 2026 compensation. Percentile ranges (P10–P90) represent the full salary distribution across experience levels and practice settings in this market.
Data Sources & Methodology
Salary data for Northampton is estimated from official BLS state-level occupational wage data (2025), adjusted for regional cost-of-living differences using BEA RPP (Regional Price Parities).
2026 figures are projected from 2025 BLS data using a compound annual growth rate (CAGR) of 2.61%, derived from historical BLS wage trends for accountants (SOC 13-2011).
Compiled and verified by Sofia Patel, CPA, a licensed accountant with 10+ years of clinical experience. · View source data at BLS.gov