Accountant Salary in Richmond, CA: $87,740 (2026)
Quick Answer:A full-time accountant in Richmond, CA earns a median $87,740/year (≈ $42.18/hour) in nominal terms for 2026 — projected from BLS OEWS 2025 (SOC 13-2011). Once you factor in Richmond's price level (13% above national, BEA RPP 113.1), that paycheck buys what $77,577 would nationally. Nominal pay sits 1.9% above the California state average.
Based on BLS state-level estimates · View source
In Richmond, California, accountants can expect a median annual salary of $87,740, which surpasses the national median of $85,864 by approximately 2.18%. This figure places Richmond within a competitive salary range for the profession, with earnings spanning from $55,323 at the lower end (10th percentile) to $135,996 for top earners (90th percentile). These insights are based on 2025 BLS data, projected to 2026, and include local estimates that account for regional price adjustments. The city's accountant salary reflects a distinct divide influenced by employer types: while Big 4 firms typically lead in compensation, mid-tier and corporate accounting roles also offer substantial pay, providing numerous opportunities for local professionals to advance their careers.
About the Richmond Market
Salary estimated from California average ($102,000) adjusted for local cost of living.
Salary Breakdown
| Percentile | Annual | Hourly |
|---|---|---|
| Entry Level (P10) | $55,323 | $26.60 |
| Lower Range (P25) | $67,481 | $32.45 |
| Median (P50)(typical) | $87,740 | $42.18 |
| Upper Range (P75) | $112,307 | $53.99 |
| Top Earners (P90) | $135,996 | $65.38 |
Median Salary Position
2.18% above the national average
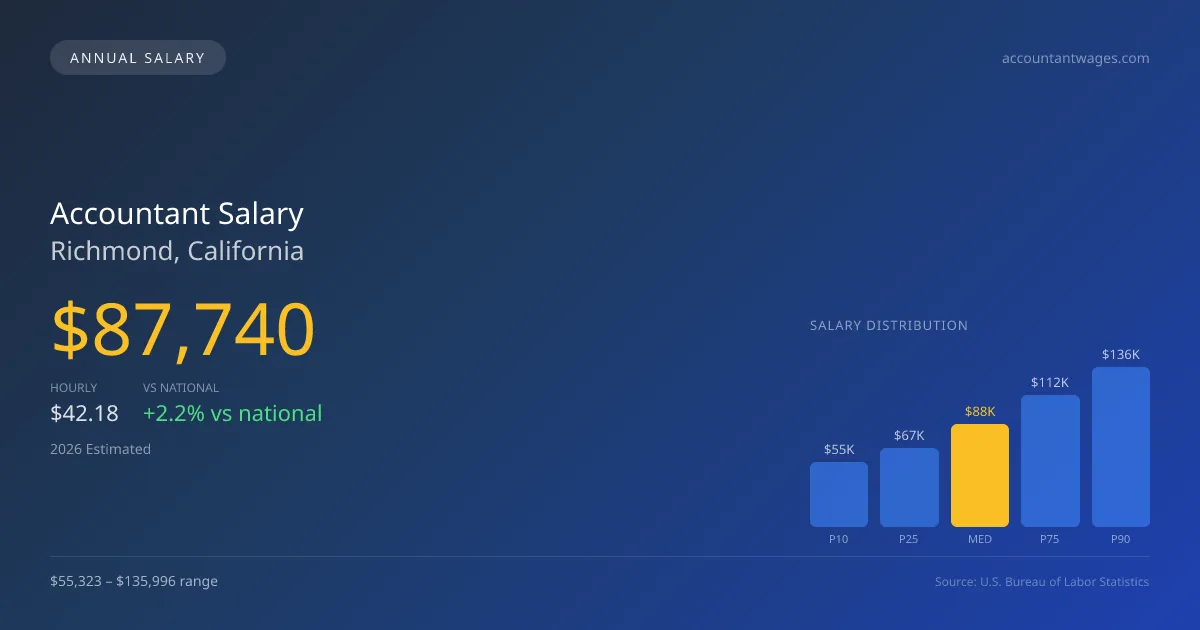
2026 Salary Percentile Distribution in Richmond
In Richmond, CA, the accountant salary spread from the 10th to 90th percentile is $80,673 (2026 est.). At $87,740, the local median is 2.18% above the national median of $85,864.
Salary Calculator
At 40 hours/week in Richmond: You'd be in the lower-middle range
How Richmond Accountant Pay Compares
Richmond median: $87,740/year (2026)
| Compared To | Median Salary | Richmond Pays |
|---|---|---|
| California Average | $86,104 | +1.90% more |
| National Average | $85,864 | +2.18% more |
Accountants in Richmond, CA earn a median of $87,740 per year (2026 est.), which is 2.18% higher than the national median of $85,864 and 1.90% above the California state average of $86,104.
Cost-of-Living Adjusted Salary
Richmond has a cost of living 13.10% above the national average.
Adjusted salary = nominal × (100 / CoL index). CoL index: 100 = national average.
Richmond, CA has a cost-of-living index of 113.1 (above the national average of 100). While the nominal salary of $87,740 is competitive, the higher cost of living reduces purchasing power to an effective $77,577 — a 11.58% reduction.
Compare Purchasing Power
Select a city to see how your salary compares after cost of living
Select a city above to compare purchasing power
2019 BLS Actual
$73,113
2025 BLS Actual
$85,508
2026 Current Est.
$87,740
2019–2027 Growth
+23.1%
Salary Trajectory for Accountants in Richmond (2019–2027)
2019–2025: actual BLS OEWS data for this metro area. 2026+: CAGR 2.61% projection.
| Year | Annual Salary | Status |
|---|---|---|
| 2019 | $73,113 | Actual |
| 2020 | $75,167 | Actual |
| 2021 | $78,938 | Actual |
| 2022 | $79,704 | Actual |
| 2023 | $81,625 | Actual |
| 2024 | $117,546 | Actual |
| 2025 | $85,508 | Actual |
| 2026(current) | $87,740 | Estimated |
| 2027 | $90,030 | Projected |
Based on 7 years of BLS OEWS data for the Richmond metropolitan area, the median accountant salary grew 17.0% from $73,113 (2019) to $85,508 (2025). At a 2.61% compound annual growth rate, salaries are projected to reach $90,030 by 2027 — a total increase of $16,917 (23.14%) from 2019.
Note: Historical values (2019–2025) are actual BLS OEWS figures for the Richmond metropolitan area, sourced from annual Occupational Employment and Wage Statistics surveys. 2026–2026 figures are current estimates, and 2027 values are projections, calculated using a 2.61% CAGR derived from 7-year BLS historical data. Actual salaries may vary based on employer, experience, certifications, and local market conditions.
Salary by Experience Level
| Experience | Estimated Salary Range |
|---|---|
| 0-2 years (New Graduate) | $55,323 – $67,481 |
| 3-5 years (Mid Career) | $67,481 – $87,740 |
| 5+ years (Experienced) | $87,740 – $112,307 |
| 10+ years (Top Earner) | $112,307 – $135,996 |
CPA salary ranges estimated from BLS percentile data. Individual accountant compensation varies by employer, certifications, and specialization.
Accountant Job Market in Richmond
Currently, approximately 25 accountants are employed in Richmond, forming a niche yet impactful sector of the job market. The cost of living index in the city stands at 113.1, indicating that while salaries may be higher than national averages, the purchasing power of those salaries is somewhat diminished by elevated living expenses. Among employers, Big 4 firms tend to offer the most competitive pay structures, driven by the prestige of the firms and their significant resources. However, local CPA firms, corporate roles, and specialized practices also contribute to the salary spectrum. Factors contributing to the broad income range include educational qualifications, such as CPA licensure, and industry experience, with accountants who specialize in areas like taxation or forensic accounting often commanding premium pay. For individuals aspiring to maximize their earnings in Richmond, pursuing advanced qualifications, considering diverse industry roles, and remaining adaptable to shifting job demands will be crucial strategies.
More salary data for Richmond, CA:
Frequently Asked Questions
How much do accountants make in Richmond, CA in 2026?
Is Richmond, CA a good place to work as a accountant?
Can accountants make $100K in Richmond?
What is the cost-of-living adjusted accountant salary in Richmond?
How much does a accountant make per hour in Richmond?
Related Pages
Compare Salaries
Career Resources
Nearby Cities in California
Written by Sofia Patel, CPA
Career Analyst
Sofia Patel has over 10 years of experience in financial analysis. She specializes in tax preparation for small businesses. She has worked in both corporate and public accounting environments.
Methodology & Data Source
Salary figures on this page are 2026 projections based on the Bureau of Labor Statistics Occupational Employment and Wage Statistics (OEWS) survey, May 2026 release. The BLS reported a median annual salary of $85,508 for accountantsin the Richmond metropolitan area. A 2.61% compound annual growth rate (CAGR), calculated from 6-year national BLS wage trends, was applied to project current 2026 compensation. Percentile ranges (P10–P90) represent the full salary distribution across experience levels and practice settings in this market.
Data Sources & Methodology
Salary data for Richmond is estimated from official BLS state-level occupational wage data (2025), adjusted for regional cost-of-living differences using BEA RPP (Regional Price Parities).
2026 figures are projected from 2025 BLS data using a compound annual growth rate (CAGR) of 2.61%, derived from historical BLS wage trends for accountants (SOC 13-2011).
Compiled and verified by Sofia Patel, CPA, a licensed accountant with 10+ years of clinical experience. · View source data at BLS.gov